Showing posts with label trading basics. Show all posts

Saturday, August 24, 2013

Support and Resistance line

Support line can be thought of as a floor for the price while resistance can be thought of as the ceiling for the price. When the price breaks through a resistance, that level becomes the new support level. The reverse is true when the price breaks through a support level.


The best use of support and resistance is during trend trading. If the trend is up, you want to go long at support and take profit at resistance. If the trend is down, you want to go short at resistance and take profit at support.

Support and resistance levels are sometimes not exact price levels. Many times, they will be a small range of prices. Once the price clearly breaks past that range of prices, support or resistance is to be considered broken.

Support and resistance should be used as reference points when looking at a forex chart and trying to make a decision. They can give you a good idea of where to put your stop loss or take profit orders.

Thursday, July 18, 2013

line chart

A line chart is the most basic and simplest type of stock charts that are used in technical analysis. The line chart is also called a close-only chart as it plots the closing price of the underlying security, with a line connecting the dots formed by the close price. In a line chart the price data for the underlying security is plotted on a graph with the time plotted from left to right along the horizontal axis, or the x-axis and price levels plotted from the bottom up along the vertical axis, or the y-axis. 


The price data used in line charts is usually the close price of the underlying security. The uncluttered simplicity of the line chart is its greatest strength as it provides a clean, easily recognizable, visual display of the price movement. This makes it an ideal tool for use in identifying the dominant support and resistance levels, trend lines, and certain chart patterns.

Bar chart

Bar charts are one of the most popular forms of stock charts and are probably the most widely used charts. Bar charts are drawn on a graph that plots time on the horizontal axis and price levels on the vertical axis. The chart consists of a series of vertical bars that indicate various price data for each time-frame on the chart. This data can be either the open price, the high price, the low price and the close price, making it an OHLC bar chart, or the high price, the low price and the close price, making it an HLC bar chart. The height of each OHLC and HLC bar indicates the price range for that period with the high at the top of the bar and the low at the bottom of the bar. Each OHLC and HLC bar has a small horizontal tick to the right of the bar to indicate the close price for that period. An OHLC bar will also have a small horizontal tick to the left of the bar to indicate the open price for that period.


The extra information is one of the reasons why the OHLC charts are more popular than HLC charts. In addition, some charting applications use colors to indicate bullish or bearishness of a bar in relation to the close of the previous bar. This makes the OHLC bar chart quite similar to the candlestick chart, except that the OHLC chart does not indicate bullishness or bearishness of the period of one bar as clearly as the candlestick chart (the color of an OHLC bar is always in relation to the close of the pervious bar rather than the open and close of the current bar).

Point and Figure Charts

Point and Figure (P&F) charts date back to at least 1880's and differ from other stock charts as it does not plot price movement from left to right within fixed time intervals. It also does not plot the volume traded. Instead it plots unidirectional price movements in one vertical column and moves to the next column when the price changes direction. It represent increases in price by plotting X's in the column and decreases in price by plotting O's. Each X and O represents a box of a set size or price amount. This box size determines how far the price must move before another X or O is added to the chart, depending on the direction of the price movement. Thus if the box sixe is set at 15, the price must move 15 points above the previous box before the next X or O is plotted. Any movement below 15 is ignored. For this reason, very little plotting occurs during stagnant market conditions while a considerable amount of plotting may occur during volatile market conditions.


The chart also has a box reversal amount that determines how many boxes must occur in the opposite direction before it is seen as a reversal. Only once the price is seen as having reversed is a new column started. In a 3 box reversal requires the price to move three boxes (of 45 points if each box represents 15 points) against the current direction before it is seen as a reversal.

Candlestick Charts


Japanese candlestick charts form the basis of the oldest form of technical analysis. They were developed in the 17th century by a Japanese rice trader named Homma. Candlestick charts provide the same information as OHLC bar charts, namely open price, high price, low price and close price, however, candlestick charting also provide a visual indication of market psychology, market sentiment, and potential weakness, making it a rather valuable trading tool.


Candlesticks indicate a bullish up bar, when the closing price is higher than the opening price, using a light color such as white or green, and a bearish down bar, when the closing price is lower than the opening price, using a darker color such as black or red for the real body of the candlestick. Thus, on a green candlestick, the close price will be at the top of the candlestick real body and the open price at the bottom as the close price is higher than the open price; conversely on a red bar the close price will be at the bottom of the candlestick real body and the open price at the top as the close price is lower than the open price.

 For both a bullish and a bearish candlestick, the high price and the low and the low price for the session will be indicated by the top and bottom of the thin vertical line above and below the real body. This vertical line is called the shadow or the wick.


The shape and color of a candlestick can change several times during its formation. Therefore the trader must wait for the candlestick to be formed completely at the end of the time-frame to analyze the candlestick, forcing the trader to wait for the bar to close.

Technical Theory

Fundamental analysis is based upon the traditional study of supply and demand factors that cause prices to rise or fall. Such factors include drought, flood, war, politics, exchange rates, inflation and deflation. The previous section on supply & demand and stocks/use ratios are methods used by fundamentalists to arrive at an estimate of the equilibrium market price of a commodity over time in order to determine if the current market price is over or undervalued.

Technical or chart analysis, by contrast, is based upon the study of the market action itself. While fundamental analysis studies the reasons or causes for prices going up or down, technical analysis studies the effect of the price movement itself. Technical analysts claim that markets do trend and that by charting market prices you can control commodity price risk management.

 They further claim that by combining the use of price charts with appropriate marketing tools and pricing strategies can have a major positive impact on your profitability and, therefore, the long term survival of your business. Charting can be used by itself with no fundamental input, or in conjunction with fundamental information. You will find that as you become more skilled in charting and technical analysis, that the illusion of randomness in the commodity market will gradually disappear. This will lead to more confidence in making those very crucial marketing decisions.

The ability to make commodity price forecasts is only the first step in the price decision making process. The second, and often more difficult step, is market timing. Since commodity futures markets are so highly leveraged, minor price moves can have a dramatic impact on trading performance.
Therefore, the precise timing of entry and exit points is an indispensable aspect of any market commitment. Timing is everything when dealing in the commodities markets, and timing is almost purely technical in nature. This is where a practical application of charting principles becomes absolutely essential in the price forecasting and risk management process.


Basic assumptions of which technical analysis

1. The futures market discounts everything.

The technician believes that the price posted on the board of a commodity exchange at any given time is the intrinsic value of the commodity based upon the fundamental factors affecting the supply and demand of the product. Therefore, if the fundamentals are already reflected in the price, market action (charts- price, volume, open interest) is all that is needed to be studied to forecast future price direction. Although not knowing the specifics of the fundamental news, the technician indirectly studies the fundamentals by studying the charts which reflect the fundamentals of the marketplace.

2. Prices move in trends

Prices can move in one of three directions, up, down or sideways. Once a trend in any of these directions is in effect it usually will persist. The market trend is simply the direction of market prices, a concept which is absolutely essential to the success of technical analysis. Identifying trends is quite simple; a price chart will usually indicate the prevailing trend as characterized by a series of waves with obvious peaks and troughs. It is the direction of these peaks and troughs that constitutes the market trend.

3. History repeats itself

Technical analysis includes the psychology of the market place. Patterns of human behavior have been identified and categorized for several hundred years and are repetitive in nature. The repetitive nature of the marketplace is illustrated by specific chart patterns which will indicate a continuation of or change in trend.

Tuesday, July 9, 2013

What are the Sensex & the Nifty?


The Sensex is an "index". What is an index? An index is basically an indicator. It gives you a general idea about whether most of the stocks have gone up or most of the stocks have gone down.

The Sensex is an indicator of all the major companies of the BSE.

The Nifty is an indicator of all the major companies of the NSE.

If the Sensex goes up, it means that the prices of the stocks of most of the major companies on the BSE have gone up. If the Sensex goes down, this tells you that the stock price of most of the major stocks on the BSE have gone down.

Just like the Sensex represents the top stocks of the BSE, the Nifty represents the top stocks of the NSE.

Just in case you are confused, the BSE, is the Bombay Stock Exchange and the NSE is the National Stock Exchange. The BSE is situated at Bombay and the NSE is situated at Delhi. These are the major stock exchanges in the country. There are other stock exchanges like the Calcutta Stock Exchange etc. but they are not as popular as the BSE and the NSE.Most of the stock trading in the country is done though the BSE & the NSE.

Besides Sensex and the Nifty there are many other indexes. There is an index that gives you an idea about whether the mid-cap stocks go up and down. This is called the “BSE Mid-cap Index”. There are many other types of indexes.

Types of currency trading strategies.


Currency trading strategies can fall into a couple of basic categories. The main reason is normally the driving force behind the signals that this strategies produce. The type of currency trading strategy that you choose is an entirely personal thing, but should be based upon comfort, and the overall trading results.
One type of currency trading strategy is based completely on the differential of two countries interest rates. What is meant by this is that if the interest rate of Great Britain happens to be 2%, and the interest rate of Japan is 0.5%, the trader would by British Pounds, and sell the Japanese Yen. The thinking behind this is that money tends to flow where it is treated better. With a higher interest rate and Great Britain, it should follow that there will be more investment in that country. As investors flood into the UK, it stands to reason that they will be buying the British Pound.
Another type currency trading strategies based upon the fundamentals of both countries. And while this somewhat ties in with the differential of interest rate type of strategy, it does take into account a much larger picture of economic information. The idea is to buying the currency of the country that is more likely to raise interest rates in the future that another. If you find that the economic numbers out of a particular country are better than another, you will apply that currency and sell the other one. Fundamental trading can be a bit tricky however, as it generally doesn't have a set entry or exit point.
One of the most common types of trading strategies in the currency market are systems that are based on technical analysis. Under this heading, there are literally hundreds and thousands of systems to choose from. These systems tend to incorporate a technical indicator, or group of them, with simple price action. They can be as basic as systems that incorporate support and resistance with trend lines, or a bit more complicated such as a system that incorporates the ADX, MACD and the RSI, along with price action and perhaps moving average or two.
The simple truth is that there is no "one size fits all" type of trading system out there for the currency trader to use. You simply have to try and figure out what works best for you personally. While it takes a little bit of trial and error, and diligent record-keeping, going through the process of finding the perfect system for your situation is the foundation for becoming a profitable trader.

Trading tips for successful day trading.

The following is a short list of trading tips that can help you stay focused and on a profitable path while day trading.
  • Formulate a trading plan and stick to it. You should know all of your positions, the entries, possible exit targets, and where your stops are going to be before you place a trade online. This helps take the emotion out of the situation.
  • Know the direction of the overall trend. The successful trader tends to follow the trend at all times. If you have the weight of the market behind you, it is much easier to make profits.
  • Protect your trading capital. By trading the correct position size relative to the size of your portfolio, you can keep from having disastrous losses. If you are swinging for the fences on every trade, you are eventually going to strike out. Another way to protect your trading capital is to let a loss go. If you have a losing day trade, never chase it. This almost always leads to compounding losses.
  • Do not be greedy. Figure out your exit before getting into the trade, and take your profits when they are offered.
  • Leave your emotions at the door. By leaving your emotions out of the equation, you can save yourself for making serious and costly mistakes.
  • Don't be a copycat. Do not try to follow somebody else's trading, as what works for them probably won't work for you. Do your own work, and you will come out ahead in the long run.
  • Keep a journal. You should write detailed notes on every trade you take. Write down the technical setup, the fundamentals set up, and any thoughts or emotions that you had while placing trades.
  • Confusion is a signal as well. When confused, simply stay out of the market. There is no reason to press the issue when you don't understand what is going on. It is at this point where trading simply becomes gambling, and gambling is not we are here to do.
  • Never trade out of boredom. Trading out of boredom can be in account killer. Many traders will place trades just to place a trade, with no more thought or strategy than the knowledge that it's a possibility they may make money if they place trade. Again, this is simply gambling and not trading.
You are responsible for the way your day trading business operates. It is you that has to take responsibility for the choices that are made in your trading account. By keeping the short list of rules in mind, you can increase the odds that your choices are at the very least made with logic and rational thinking. Breaking these rules are some of the quickest ways to lose money in the markets.
1.Currency Trading Strategies
Currency trading strategies can fall into a couple of basic categories. The main reason is normally the driving force behind the signals that this strategies produce. The type of currency trading strategy........Currency Trading Strategies

2.Trading Tips
The following is a short list of trading tips that can help you stay focused and on a profitable path while day trading. . . . Trading tips


Forex Trading

The forex (foreign currency exchange) market is the largest and most liquid financial market in the world. The forex market unlike stock markets is an over-the-counter market with no central exchange and clearing house where orders are matched.


Traditionally forex trading  has not been popular with retail traders/investors (traders takes shorter term positions than investors) because forex market was only opened to Hedge Funds and was not accessible to retail traders like us. Only in recent years that forex trading is opened to retail traders. Comparatively stock trading has been around for much longer for retail investors. Recent advancement in computer and trading technologies has enabled low commission and easy access to retail traders to trade stock or foreign currency exchange from almost anywhere in the world with internet access. Easy access and low commission has tremendously increased the odds of winning for retail traders, both in stocks and forex. Which of the two is a better option for a trader? The comparisons of retail stock trading and retail forex trading are as follows;

Nature of the Instrument

The nature of the items being bought and sold between forex trading and stocks trading are different. In stocks trading, a trader is buying or selling a share in a specific company in a country. There are many different stock markets in the world. Many factors determine the rise or fall of a stock price. Refer to my article in under stock section to find more information about the factors that affect stock prices. Forex trading involves buying or selling of currency pairs. In a transaction, a trader buys a currency from one country, and sells the currency from another country. Therefore the term “exchange”. The trader is hoping that the value of the currency that he buys will rise with respect to the value of the currency that he sells. In essence, a forex trader is betting on the economic prospect (or at least her monetary policy) of one country against another country.

Market Size & Liquidity

Forex market is the largest market in the world. With daily transactions of over US$4 trillion, it dwarfs the stock markets. While there are thousands of different stocks in the stock markets, there are only a few currency pairs in the forex market. Therefore, forex trading is less prone to price manipulation by big players than stock trading. Huge market volume also means that the currency pairs enjoy greater liquidity than stocks. A forex trader can enter and exit the market easily. Stocks comparatively is less liquid, a trader may find problem exiting the market especially during major bad news. This is worse especially for small-cap stocks. Also due to its huge liquidity of forex market, forex traders can enjoy better price spread as compared to stock traders.

Trading Hours & Its Disadvantage to Retail Stock Traders

Forex market opens 24-hour while US stock market opens daily from 930am EST to 4pm EST. This means that Forex traders can choose to trade any hours while stock traders are limited to 930am EST to 4pm EST. One significant disadvantage of retail stock traders is that the stock markets are only opened to market makers during pre-market hours (8:30am – 9:20am EST) and post-market hours (4:30pm – 6:30pm EST). And it is during these pre-market and post-markets hours that most companies release the earnings results that would have great impact on the stock prices. This means that the retails traders (many of us) could only watch the price rise or drop during these hours. Besides, stop order would not be honored during this times. The forex traders do not suffer this significant disadvantage. Also, a stock trader may supplement his/her trading with forex trading outside the stock trading hours.

Affordability

In order to trade stocks, a trader needs to have quite a significant amount of capital in his account, at least a few tens of thousands in general. However, a forex trader can start trading with an account of only a few hundreds dollars. This is because forex trading allows for higher leverage. A forex trader could obtain larger transaction compared to stock market. Some forex brokers offers 100:1, 200:1 or 400:1. A leverage of 100:1 means that a US$1k in account could obtain a 100 times transaction value at US$100k. There is no interest charge for the leveraged money. Stock trading generally allows for not more than 2 times leverage in margin trading. There are interest charges associated with margin trading.

Data Transparency & Analysis Overload

There are thousands of different stocks in different industries. trader needs to research many stocks and picks the best few to trade. There are many factors that affect the stock prices. There are much more factors that may affects stock price than foreign currency exchange rates. The forex traders therefore can focus on few currency pairs to trade. On top of that, most data or news affecting currency exchange rate are announced officially, scheduled and in a transparent manner. Retail forex traders therefore have better chances of success than retail stock traders.

Bear/Bull Stock Market Conditions

Forex traders can trade in both way buying or selling currency pairs without any restrictions. However, stock traders have more constraints to trade and profit in bear market condition. There are more restrictions and costs associated with stock short selling. In a bull market when the economy is doing well, stock traders have a high chance of profitability if they buy stock first then sell it later. Savvy forex traders however, could operate in all market conditions.


Trending Nature of Currency

Major currencies are influenced by national financial policies and macro trends This national financial policies and macro trends tend to last long in a certain direction, either in monetary expansionary (rate cutting) or monetary contractionary cycle (rate hiking cycle). Stock prices however tend to fluctuate up and down due to many factors, many of these factors are micro and specific to the stocks. Therefore forex traders can better exploit the trends in foreign currency markets that stock traders in stock markets.


Regulation

Generally, most major stock markets are better regulated than forex markets. Therefore, traders need to be aware of this difference to stock markets. Fortunately, there are however many reputable forex brokers in the market. With prudence and proper research, it is not difficult to find a suitable reliable forex brokers.
Based on the above few points, forex trading seems to be a better trading option than stock trading, especially during these uncertainties in the global economy. During bull market condition, stock trading could be a viable alternative. A stock trader should definitely seriously consider supplementing their trading with forex trading. Forex trading enables a stock trader to exploit any opportunity arises during non stock trading hours, by trading in forex trading. Forex trading would also enable the stock traders to understand a more complete big picture of world economies operations and further enhance their stock trading skills.

Based on the above few points, forex trading seems to be a better trading option than stock trading, especially during these uncertainties in the global economy. During bull market condition, stock trading could be a viable alternative. A stock trader should definitely seriously consider supplementing their trading with forex trading. Forex trading enables a stock trader to exploit any opportunity arises during non stock trading hours, by trading in forex trading. Forex trading would also enable the stock traders to understand a more complete big picture of world economies operations and further enhance their stock trading skills.

Commodities


Commodities is simply a label applied to items that are produced to satisfy human wants or needs. A commodity can be bought or sold through futures contracts on specific exchanges. An exchange will usually specify a minimum quality and quantity that can be bought.

People like to trade commodities as they use them in everyday life. The price direction of commodities can sometimes be easier to predict than shares in companies.

Companies will also trade in commodities. A typical example of this is an airline betting that crude oil prices will rise. By making money if crude oil rises, they can offset any loses the company would make by spending on petrol during flights. This is known as hedging, and means the airline company can apply a set cost to crude oil, when designing future business plans.


Top 10 traded commodities (in order of popularity) ;


  1. Crude Oil
  2. Coffee
  3. Natural Gas
  4. Gold
  5. Brent Oil
  6. Silver
  7. Sugar
  8. Corn
  9. Wheat
  10. Cotton


Gold

Many people like the idea of buying gold as the price never seems to drop. Due to the collapse of several banks over the past decade, gold is now also seen as a safer investment. As you can see below, the price of gold has generally risen over the last 20 years.


Add caption

The chart clearly shows that investing in gold over the last 20 years would have provided a better rate of interest than leaving money in a savings account.


Why Invest in Gold?


Gold has always seemed to play a pretty big role in world history. Many cities exist or don't exist today because of the discovery of gold or because of the greed inspired by gold.
At one point in time all the currency in the United States was backed up by gold.

Investing in gold and silver is typically done as a safe-haven against political, economic, social, currency-based or other crisis.
Typically when the economy is struggling the price of gold and other precious metals goes up dramatically.
How to Invest in Gold?

There are different approaches to take. You should make sure that the approach you take is right for you and fits your comfort level. Some possibilities include:
Directly through gold coins or gold bullion investing
Indirectly through investing in gold options, investing in gold stocks, gold exchange traded funds, accounts, or certificates


Historic Gold Investing Prices


I made a couple of charts for you to reference to help understand where the price of gold has been in the past.


Gold Prices: Last 110 Years


Gold Prices: Last 20 Years


Oil

Crude oil is one of the most talked about traded commodities as it has the widest impact on society. It affects many sectors such as the transport sector, the energy sector and of course the oil & gas sector! As a commodity, crude oil is normally purchased in batches of 1,000 barrels.

Crude oil can be invested in directly through commodities and also indirectly through oil ETF’s and stock in individual oil companies.

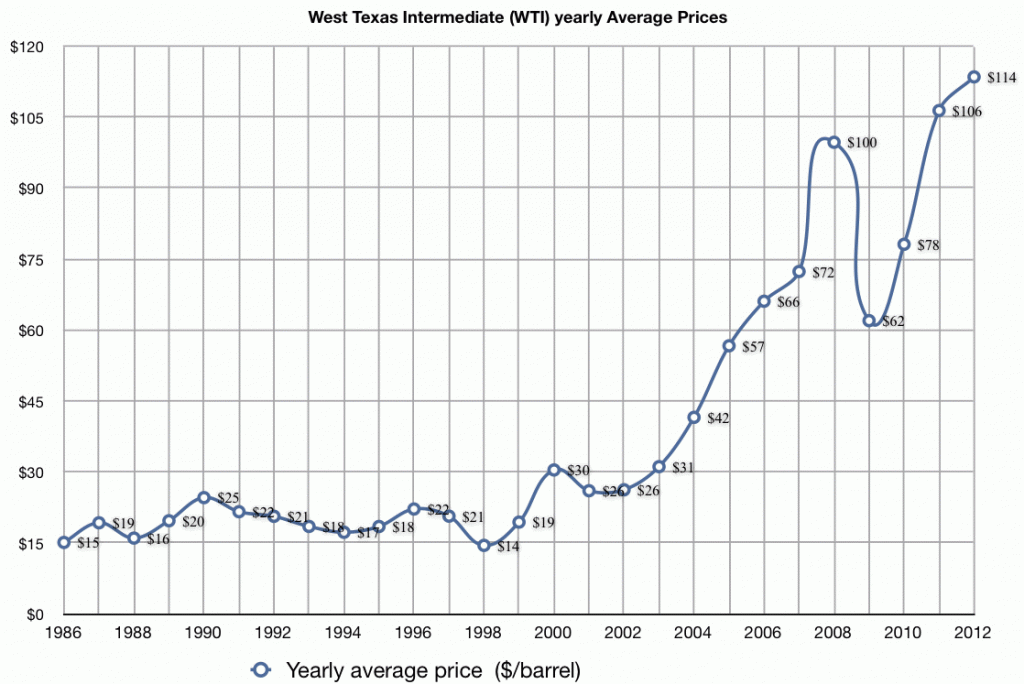
As you can see by the chart below, demand currently heavily outweighs supply of crude oil, meaning the price of oil has risen sharply over recent times.


Monday, July 8, 2013

What Is Technical Analysis? 

Technical analysis is a method of evaluating securities by analyzing the statistics generated by market activity, such as past prices and volume. Technical analysts do not attempt to measure a security's intrinsic value, but instead use charts and other tools to identify patterns that can suggest future activity.

Just as there are many investment styles on the fundamental side, there are also many different types of technical traders. Some rely on chart patterns, others use technical indicators and oscillators, and most use some combination of the two. In any case, technical analysts' exclusive use of historical price and volume data is what separates them from their fundamental counterparts. Unlike fundamental analysts, technical analysts don't care whether a stock is undervalued - the only thing that matters is a security's past trading data and what information this data can provide about where the security might move in the future.

The field of technical analysis is based on three assumptions:

1. The market discounts everything.
2. Price moves in trends.
3. History tends to repeat itself.


1. The Market Discounts Everything 

A major criticism of technical analysis is that it only considers price movement, ignoring the fundamental factors of the company. However, technical analysis assumes that, at any given time, a stock's price reflects everything that has or could affect the company - including fundamental factors. Technical analysts believe that the company's fundamentals, along with broader economic factors and market psychology, are all priced into the stock, removing the need to actually consider these factors separately. This only leaves the analysis of price movement, which technical theory views as a product of the supply and demand for a particular stock in the market.

2. Price Moves in Trends 

In technical analysis, price movements are believed to follow trends. This means that after a trend has been established, the future price movement is more likely to be in the same direction as the trend than to be against it. Most technical trading strategies are based on this assumption.

3. History Tends To Repeat Itself 

Another important idea in technical analysis is that history tends to repeat itself, mainly in terms of price movement. The repetitive nature of price movements is attributed to market psychology; in other words, market participants tend to provide a consistent reaction to similar market stimuli over time. Technical analysis uses chart patterns to analyze market movements and understand trends. Although many of these charts have been used for more than 100 years, they are still believed to be relevant because they illustrate patterns in price movements that often repeat themselves.


Not Just for Stocks 

Technical analysis can be used on any security with historical trading data. This includes stocks, futures and commodities, fixed-income securities, forex, etc. In this tutorial, we'll usually analyze stocks in our examples, but keep in mind that these concepts can be applied to any type of security. In fact, technical analysis is more frequently associated with commodities and forex, where the participants are predominantly traders.

Now that you understand the philosophy behind technical analysis, we'll get into explaining how it really works. One of the best ways to understand what technical analysis is (and is not) is to compare it to fundamental analysis. We'll do this in the next section. 

What is the actual process to buy shares?


1. First of all you need to deposit some funds in a brokerage account.

2. You then use your brokerage account to obtain a quote for the stock that you are interested in (you can do this online or over the phone), they then send a request of to the market maker.

3. The market maker (firms that quote the buy an sell price of a stock) then issues you with a buy (ask) price and sell (bid) price for your chosen share.

Note: The difference between the bid and ask price quotes is where they make their money.

4. You then send an order to the market, from your brokerage account, detailing the stock you want to buy, how many shares you want of that stock and what price you are willing to pay for the stock.

5. If the price you set meets the quote the market maker has set then you will enter the trade!

Note: You will be charged a fee of around £8-12 UK and $2-8 US depending on which broker you use, this fee covers the purchase and sale of a share. Also, whether you buy 1, 100, or 100,000 shares, you will get charged the same fee. Brokers charge you per transaction and not by how many shares you buy.

Why buy shares?


1. Financial returns


Investors can realistically make a 50%+ return a year on their capital, this compared to the interest rate offered in banks (often around 1-5%), is a massive difference.

Example

Obviously a 50%+ return would require a good education in trading stocks, but providing you had this, here is a financial example.

- You have $20,000
- 3% interest from a regular bank savings account would give you $600 a year.
- A 50% return from the stock market would give you $10,000 a year.

Investing in the stock market is often a major reason why the rich are rich, they can grow their money faster than other people.

2. Beating recession


You can make money when the market is going down! This is achieved by a marvelous concept called shorting. You certainly can’t make money with property when the market is in recession.

3.The lifestyle


You can work for yourself at home! No pressure from the boss, no orders around and you don’t have to deal with anyone else’s problems! That’s 4 reasons right there…

4. Tax advantages


When trading shares (UK) you are given a £9,600 capital gain tax allowance so you can make up to £9,600 without paying tax. This allowance, compared with the £6,035 income tax allowance, means you can earn an extra £3,565 tax free.

Still cant decide whether trading shares is a good idea? Here are a few extra reasons to help you decide…

1. Take the risk out of trading with stop losses
2. Earn a salary from stocks with dividend payments

To learn the steps needed to be taken to trade shares successfully, view the step by step guide to trading shares.

How old to buy shares?


There is an age limit of 18 to trade on the stock market, at least you need to be 18 to open your own brokerage account. There are ways to get a parent to open an account and you then trade with their account, this is where the parent is the custodian of the account (they get to see how well their child is doing and get monitor their trades!) and to do this the child must be at least 13.

Other options


If you are under 18 and really want to find out what trading shares is about then I recommended you open a fantasy trading account, these accounts are free to open and you use virtual money to trade with meaning there is no financial risk involved.

Sunday, July 7, 2013


Trading Basics


Learn All About Trading Basics


Trading Basics covers the founding principles of online foreign currency and trading. Read up on anything and everything you need to know about trading Indices , Commodities such Oil and Gold, and popular forex pairs such as the EUR/USD and GBP/USD.


An indicative market price, when used in Forex, refers to the prevailing exchange rate of the quoted currency at that moment. A quote will always be for a currency pair; for example EUR/USD, AUD/JPY or USD/JPY. The first currency in the pair is the quoted currency, while the second currency is referred to as the counterpart.

A currency pair is usually quoted to a 1/10,000 degree of precision (i.e. until the 4th digit right of the decimal point); except for Japanese yen pairs, where quotes are usually made to 1/100 degree of precision (i.e. to the second digit right of the decimal point).
A quote will always be provided in a form of two figures. The first figure is always the Bid or selling price, while the second is the Ask or buying price.

Bid/Ask 

The Bid or the selling price is the exchange rate at which a currency is offered for sale. The Ask or buying price is the exchange rate at which a currency can be bought.
In the example above the EUR/USD pair (Euro vs. US dollar) is quoted at 1.5034/1.5037. In other words, the quote for the EUR/USD pair is 1.5034/1.5037, where 1.5034 is the Bid price and 1.5037 is the Ask price. Meaning if you wish to sell the quoted currency – in this case the Euro – then you would receive 1.5034 US Dollars per 1 Euro. On the other hand, if you were buying the quoted currency, then the quote tells you that to buy Euros for US dollars, you would need to pay 1.5037  dollars per 1 euro.

Lot  

A lot is the standard unit size of a transaction. It represents the minimum quantity which can be traded in any given instrument.
For Forex Trading, Markets.com standard lot size is 1,000 units of the quoted currency.
For CFD Trading, the standard lot size varies from 1 to 500 units of the quoted CFD.

Pip 

This is the smallest value in a currency quote and can be different for different currencies. For most currency pairs a pip is the 1/10,000 (0.0001) fraction of the quoted currency. However, in Japanese yen pairs, a pip refers to a 1/100 (0.01) fraction of the quoted currency.
Profits on a trade can be expressed in pips, for example: Suppose you bought the EUR/USD at an exchange rate of 1.5016 and sold it at an exchange rate of 1.5037. 37-16=21. You made a 21 pip profit.

Pip Value 

The pip value can be either variable or fixed, depending on the  currency pair it refers to and the base currency (i.e. measuring  currency) of your account. The pip value is also a function of the amount traded.

The simplest way to calculate the pip value is to divide 1 pip by the exchange rate and multiply it by the lot size. This gives you the pip value in terms of the quoted currency. If the base currency of your account is other than the quoted currency, then simply multiply this by the applicable exchange rate.
For example: What is the pip value of a trade in GBP/JPY with a price of 128.92?
 The pip value of 1 standard lot (5,000) of GBP/JPY which is traded at 128.92 is:

0.01/128.92 = 0.00007756 GB
0.00007756 x 5,000=0.387 GBP

The base currency of your account is USD. If the exchange rate for GBP/USD is 2.0612, then the pip value for 1 standard lot in terms of the account's base currency is: 0.387x 2.0612 = $0.80.

Spread 

This is the difference between the bid price and the ask price. For example: If the quote for the EUR/USD pair is 1.5034/1.5037 (in other words the bid price is 1.5034 and the ask price is 1.5037), then the spread for the EUR/USD in this case is 3 pips. Low spreads ensure that traders can get in and out of their trades at very low slippage.

Leverage 

This is the use of borrowed capital to increase potential return.  Trading on leveraged capital means that you can trade amounts significantly higher than the balance of your funds, which only serves as the margin.
High leverage can significantly increase the potential return, but it can also significantly increase potential losses.

 The leverage is specified as a ratio, such as 200:1. This means that the trader can trade amounts 200 times higher than the sum in his or her margin account.
If the trader has $1,000 in his account, it means that he can now open trades worth $200,000.

Interest 

In a sense, interest is the price of money. It is the amount paid on loans and received on deposits.

Long 

A trader going long expects the price to go up when buying a currency pair or a CFD.

Short 

A trader going short expects the price to go down when selling a currency pair or a CFD.
Value date
The date on which counterparts to a financial transaction agree to settle their respective obligations, i.e., exchanging payments.

Rollover 

Process where the settlement of a deal is rolled forward to another value date and a charge is levied based on the difference in rates of interest of the two currencies.
Every day, at 21:00GMT, open positions are rolled over to the next day and the positions gain or lose interest based on the interest differential between the bought and sold currencies.
If you buy overnight a currency pair where the base currency has a higher interest rate than the terms currency, then you’ll receive interest and vice versa.

Margin

Margin can be thought of as a good faith deposit required to maintain open positions. This is not a fee or a transaction cost, it is simply a portion of your account equity set aside and allocated as a margin deposit.
Margin requirements (per 1k lot) are determined by taking a percentage of the notional trade size plus a small cushion. A cushion is added to help alleviate daily/weekly fluctuations.
Trading on margin can both positively and negatively affect your trading experience as both profits and losses can be dramatically amplified.

Bear

A person who believes that the price of a particular security or the market as a whole will go lower.
Bearish

The outlook of a person anticipating lower prices in a particular security or the market as a whole.

Bear Market

Any market in which prices are trending lower.


Bullish

The outlook of a person anticipating higher prices in a particular security or the market as a whole.

Bull Market

Any market in which prices are trending higher.

Bull Spread

Generally speaking, it is any spread that theoretically profits when the market moves up. Specifically it refers to a vertical spread.

Butterfly spread

An option position composed of either all calls or all puts (with the exception of an iron butterfly), with long options and short options at three different strikes. The options are all on the same stock and of the same expiration, with the quantity of long options and the quantity of short options netting to zero. The strikes are equidistant from each other. For example, a long 50/60/70 put butterfly is long 1*50 put, short 2*60 puts, and long 1*70 put.

Basic Fundamental analysis

Fundamental analysis is the first stage of picking stocks. The idea is to analyse companies key financial information from their published quarterly/annual reports.

Stock market traders generally look for companies that register consistent big profits and show good earnings per share growth every year when buying stocks.


Tools are available to quickly filter through thousands of companies key financial data leaving you with companies that match your criteria (the wonderful power of computers!). This is also known as stock screening.


Example


profit over last 3 years [+15%]

EPS growth over 2 years [+5%]
current ratio [between 1.3-2.5]
and end up with a list of companies that match the criteria, you can then save these companies in a spreadsheet for example. Often the list will be given to you in ticker symbol format such as;


  • MSFT
  • HP
  • GRMN
  • EBAY


With this list, you can copy and paste them straight into your trading software, saving time and tedious work (thumbs up to computers again!). Now its time to progress to the second stage of analysis – technical analysis.


Fundamental analysis helps you significantly when trading shares. There’s no point buying shares in companies that do not produce good profits as the chances of their share price rising are low. Its all about stacking the odds of your stock trade in your favor through both stages of analysis, thus consequently greatly reducing the risk of trading shares.